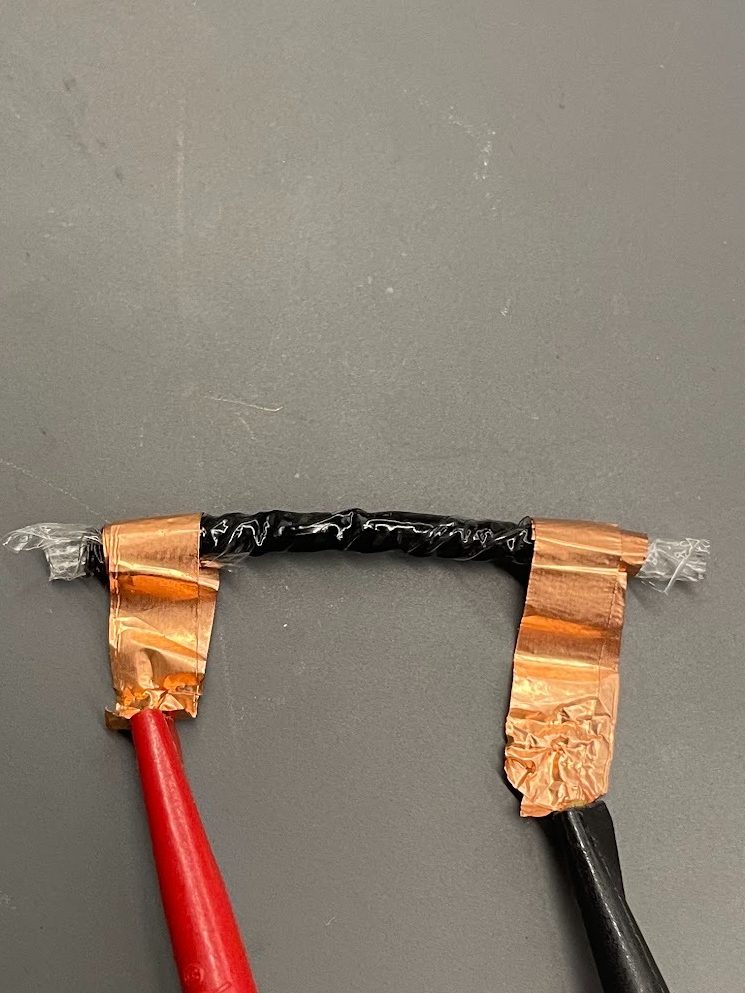
The results of our DEA and RDEA tests were unlike we expected, but still pointed to our procedures and predictions being accurate.
Movement was quantified by displacement of grease area on the paper grid. The custom printed grid size had cells with a size of 0.473mm x 0.473mm. Total displacement was calculated to be
Successful movement was identified in three DEA samples:
DEA Tests
(1) Sample 1
- PDMS curing agent: 5% (20:1)
- Capacitor Radius = 14mm
- Calculated capacitance= 0.299 nF
- Measured capacitance = 0.268 nF
0 to 500V
(0:18 to 0:26)
- total displacement = 0.16687 mm
- x-displacement = 0.1183 mm (0.25 cells)
- y-displacement = 0.1183 mm (0.25 cells)
500 to 1000V
(0:26 to 0:34)
- total displacement = 0.500631 mm
- x-displacement = 0.354 mm (0.75 cells)
- y-displacement = 0.354 mm (0.75 cells)
0 to 1000V
(0:34 to 0:57)
- total displacement = 0.5286 mm
- x-displacement = 0.473 mm (1.0 cells)
- y-displacement = 0.236 mm (0.5 cells)
The capacitance measurements were very close to the expected values, with a difference of -.031 nF. Sample 1 had a larger radius than Sample 2 by 1 mm, therefore it makes sense for the displacements to be larger in every voltage jump, especially the 0 to 1000V jump.
With less curing agent content than Sample 2, the PDMS has more flexibility and allows for easier displacement and movement observation under applied voltage.
(2) Sample 2
- PDMS curing agent =10% (10:1)
- Capacitor radius = 13mm
- Calculated capacitance= 0.2584 nF
- Measured capacitance = 0.225 nF
0 to 500V
(0:04 to 0:15)
- total displacement = 0.08522 mm
- x-displacement = 0.07095 mm (0.15 cells)
- y-displacement = 0.0473 mm (0.10 cells)
500 to 1000V
(0:15 to 0:26)
- total displacement = 0.1847 mm
- x-displacement = 0.1419 mm (0.30 cells)
- y-displacement = 0.11825 mm (0.25 cells)
0 to 1000V
(0:26 to 0:49)
- total displacement = 0.234 mm
- x-displacement = 0.1655 mm (0.35 cells)
- y-displacement = 0.1655 mm (0.35 cells)
The capacitance measurements were very close to the expected values, with a difference of -.033 nF. Sample 2 had a smaller radius than Sample 1, therefore it makes sense for the displacements to be smaller in every voltage jump.
With more curing agent content than Sample 1, there is less PDMS flexibility that inhibits the displacement ability under applied voltage in this test.
(3) First Successful Test [with HV Failure]
One DEA test went up to a voltage of 1.1kV successfully but failed on the increase to 1.2kV, burning through the PDMS and grease material. Measurements of capacitance and actuating displacement were not measured before, but this was the first successful DEA sample. (0:40 in video).
- Since there was no stretch or tension of the PDMS material attached to the acrylic ring, the center DEA area deforms and creates wrinkles because there is nowhere else for that expansion to go.
- In later samples, the PDMS is pre-stretched for ease of application and to see actual displacement of the DEA area.
RDEA Tests
The RDEA tests were inconclusive for measuring displacement of the dielectric elastomer, with the cause of this being rigidity of PDMS material and the scale of operation.
However, capacitance tests and calculations were still made for these samples.
(3) Sample 3
- PDMS curing agent =10% (10:1)
- Roll length = 3.5 inches (88.9mm)
- Capacitor area: 1 sq.in (645.16 sq.mm)
- Calculated capacitance= 0.628 nF
- Measured capacitance = 0.635 nF
Notice in this sample the capacitance is much higher than that of the regular single-sheet DEA tests, even higher than the calculated capacitance. This is because there is double the amount of contact points of grease and PDMS from the rolled feature. In a regular DEA there is only a grease/PDMS/grease area contributing as a capacitor – however, in a RDEA each top layer of grease is interacting with another PDMS/grease section, and so on. It is assumed that the effective area of capacitance was doubled , therefore leading to a high capacitance, relative to the experiment’s scale.
The difference in measured and calculated capacitance is +0.007 nF.

(4) Sample 4
- PDMS curing agent =10% (10:1)
- Roll length = 1.75 in (44.45mm)
- Capacitor area: 1 sq.in (645.16 sq.mm)
- Calculated capacitance= 0.628 nF
- Measured capacitance = unidentifiable
Sample 4 was made as a backup test for Sample 3, but unfortunately has a short in it. Capacitance measurements with an LCR meter are inconclusive, where values range from 4 nF to 0 nF. At the scale of capacitance for the experiment, this sample was not included in our data but noteworthy for discussion.